

December 2024 – April 2025
| Date | Amount | Event Total | Monthly Total | Total 2025 Season Accumulated |
|---|---|---|---|---|
| 11/22/2024 | .5 | .5 | .5 | Dusting – First Snow |
| 12/15/2024 | 1.0 | 1.0 | 1.0 | 1.5 |
| 01/03/2025 | Dusting | |||
| 01/06/2025 @ 0930 | 4.1 | |||
| @1330 | .1 | |||
| @1900 | .3 | |||
| @2300 | 1.1 | 5.6 | 7.1 | |
| 01/11/2025 | 1.2 | 1.2 | 8.3 | |
| 01/16/2025 | .4 | .4 | 8.7 | |
| 01/19/2025 @ 1400 | 1.2 | |||
| @ 1500 | 2.2 | |||
| @1600 | 2.2 | |||
| @1700 | 1.1 | |||
| @1800 | .5 | |||
| @1900-Final | .2 | 7.4 | 16.1 | |
| 01/20/2025 | .5 | .5 | 15.1 | 16.6 |
| 02/11/2025 @ 19:00 | 1.3 | |||
| @2100 | .2 | |||
| 2/12/2025 @ 0600 | 1.8 | |||
| @0800 | .2 | 3.5 | 20.1 | |
| 02/15/2025 @ 1230 | 1.1 | 1.1 | 4.6 | 21.2 |
December 2023 – April 2024
| Date | Amount | Event Total | Monthly Total | Total 2024 Season Accumulated |
|---|---|---|---|---|
| 12/11/2023 | .8 | .8 | .8 | .8 |
| December Totals | .8 | .8 | ||
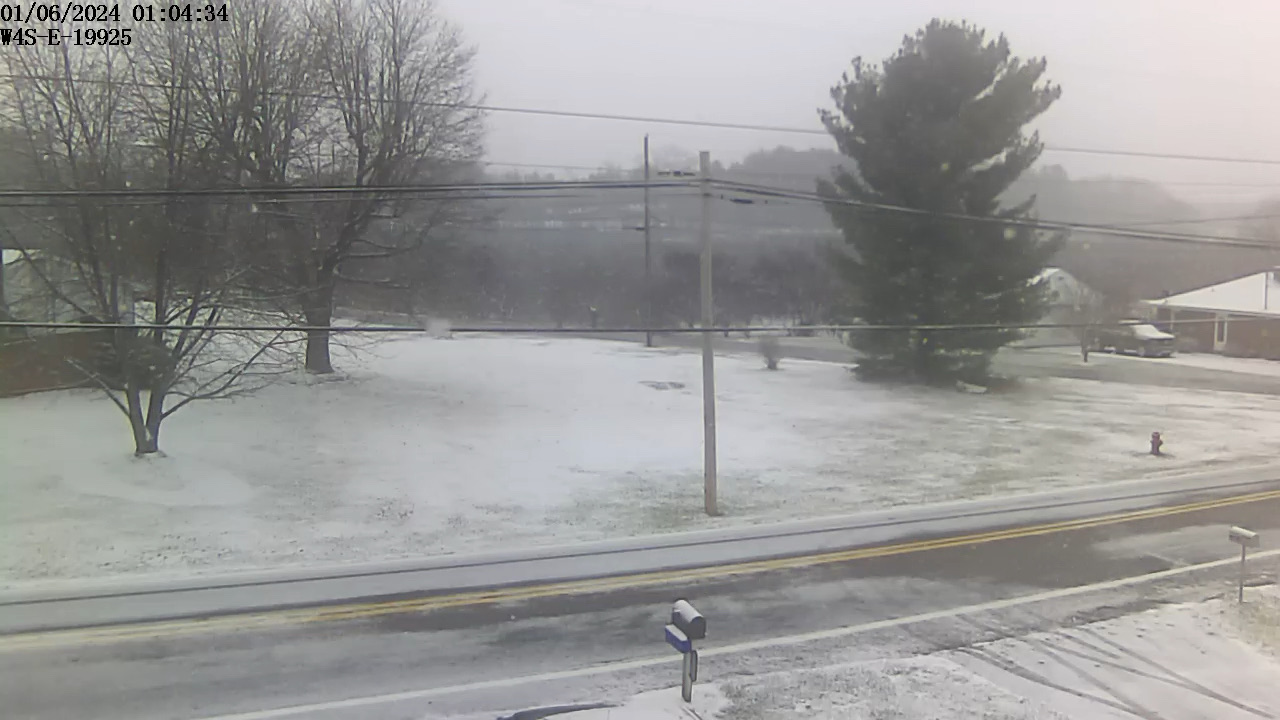
| 01/06/2024 @ 12:00 | .6 | |||
| @ 15:30 | 2.1 | 3.5 | ||
| @19:30 | .8 | 3.5 | 3.5 | 4.3 |
| 01/14/2024 | .2 | .2 | 3.7 | 4.5 |
| 1/15/2024 | .6 | |||
| 01/16/2024 @ 08:30 | 3.0 | |||
| @ 16:30 | .5 | 4.1 | 7.8 | 8.6 |
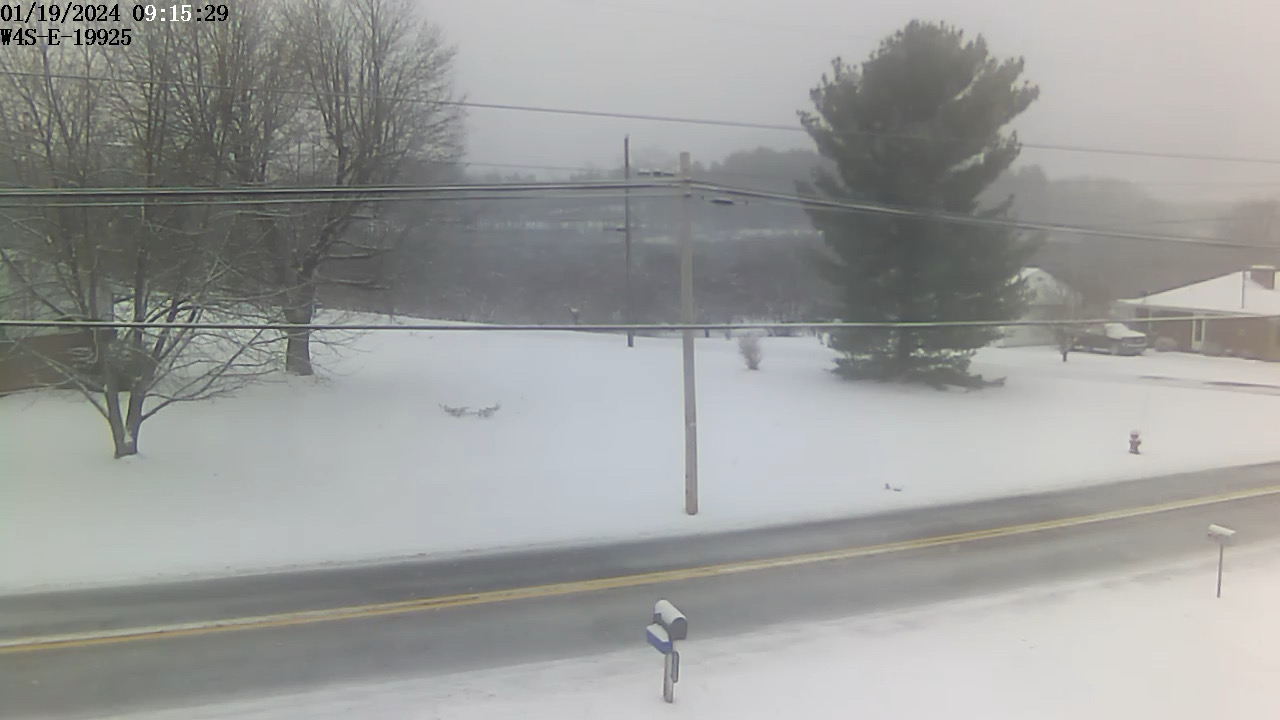
| 01/19/2024 @ 07:30 | 1.0 | |||
| @08:00 | .5 | |||
| @20:00 | 3.8 | 5.3 | 13.1 | 13.9 |
| 02/13/2024 @ 07:30 | 3.2 | |||
| @08:30 | .5 | |||
| @09:30 | .2 | 3.9 | 3.9 | 17.8 |
| 02/17/2024 @ 07:00 | 2.8 | 2.8 | 6.7 | 20.6 |
| 03/10/2024 | .3 | .3 | .3 | 20.9 |
01/19/2024 @ 08:15 am – Snow
01/06/2024 @ 12:00 noon – Snow
November 2022- April 2023
| Date | Amount | Event Total | Total 2023 Season Accumulated |
|---|---|---|---|
| 11/15/2022 | Trace | Trace | |
| 12/15/2022 | Ice | Ice | |
| 12/22/2022 | .5 | .5 | .5 |
| 01/23/2023 | 1.8 | 1.8 | 2.3 |
| 01/25/2023 | 1.5 | 1.5 | 3.8 |
| 02/01/2023 | Trace | 3.8 | |
| 03/03/2023 | .1 | .1 | 3.9 |
| 03/12/2023 | Trace | 3.9 | |
| 03/13/2023 | Trace | 3.9 |
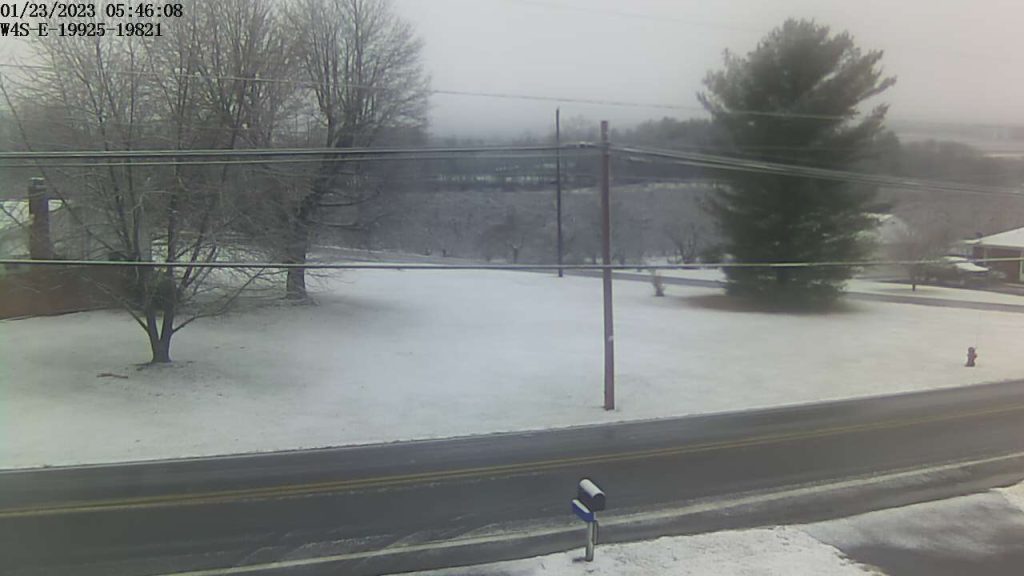
1/23/2023 – Morning Snow
November 2021 – April 2022
| Date | Amount | Event Total | Total 2022 Season Accumulated |
|---|---|---|---|
| 1/6/2022 @ 20:30 | 3.0 | ||
| 1/6/2022 @ 22:30 | 1.1 | 4.1 | |
| 1/7/2022 @ 06:30 | 3.8 | 7.9 | 7.9 |
| 1/16/2022 @ 19:00 | 2.8 | ||
| 1/16/2022 @ 20:00 | 1.3 | ||
| 1/16/2022 @ 21:00 | .6 | Sleet Started | |
| 1/17/2022 @ 06:00 | .1 Ice | 4.8 | 12.7 |
| 1/20/2022 @ 08:00 | .2 | .2 | 12.9 |
| 1/28/2022 | .6 | .6 | 13.5 |
| 2/13/2022 | 1.3 | 1.3 | 14.8 |
| 2/14/2022 | .1 | .1 | 14.9 |
| 03/12/2022 @ 07:30 | 2.5 | 2.5 | |
| 03/12/2022 @ 09:30 | 1.5 | 4.0 | |
| 03/12/2022 @ 10:30 | 1.0 | 5.0 | |
| 03/12/2022 @ 12:00 | .6 | 5.6 | |
| 03/12/2022 @ 16:00 | .5 | 6.1 | 21.0 |
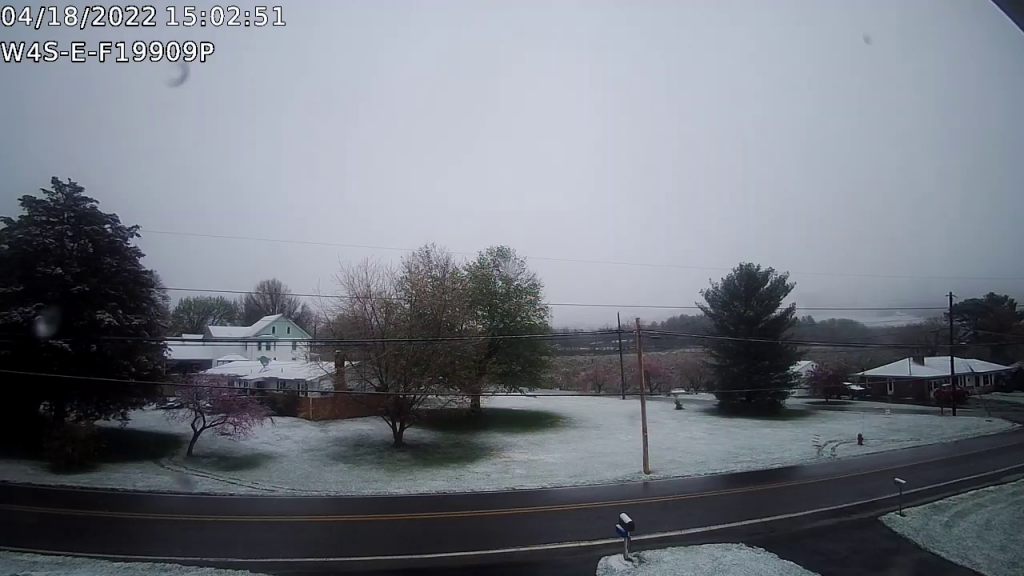
| 04/18/2022 @ 14:00 | 1.0 | 1.0 | 22.0 |
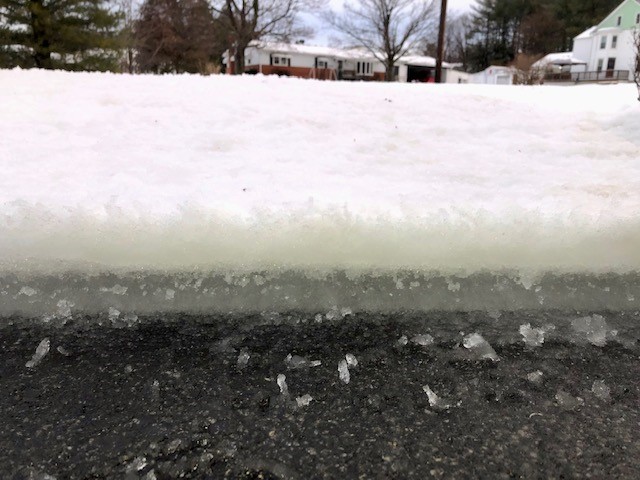
1/17/2022 Snow & Ice Layers
1/17/2022 Snow & Ice looking East

4/18/2022 Spring Snow Looking East
November 2020 – April 2021
| Date | Amount | Event Total | Total Season Accumulated |
|---|---|---|---|
| 12/14/2020 | .6 | .6 | .6 |
| 12/16-17/2020 | 10.3 | 10.3 | 10.9 |
| 12/18/2020 | .1 | .1 | 11.0 |
| 01/20/2021 | .2 | .2 | 11.2 |
| 1/25/2021 | .5 | .5 | 11.7 |
| 1/31/2021 | 5.8 as of 22:00 | 17.5 | |
| 02/01/2021 | .5 as of 06:00 | 18.0 | |
| 02/01/2021 | 9.2 as of 17:30 | 27.2 | |
| 02/01/2021 | .5 as of 19:00 | 27.7 | |
| 02/01/2021 | .1 as of 20:30 | 27.8 | |
| 02/02/2021 | .2 as of 06:30 | 28.0 | |
| 02/02/2021 | .3 as of 19:30 | 16.6 | 28.3 |
| 02/03/2021 | .5 | .5 | 28.8 |
| 02/07/2021 | 1.9 as of 09:00 | 30.7 | |
| 02/07/2021 | 1.5 as of 12:00 | 3.4 | 32.2 |
| 02/11/2021 | 3.8 as of 06:00 | 3.8 | 36.0 |
| 02/18/2021 | 1.2 as of 06:00 | 37.2 | |
| 02/18/2021 | 1.6 as of 09:00 | 38.8 | |
| 02/18/2021 | .4 as of 11:00 | 3.2 | 39.2 |
| 02/19/2021 | .7 as of 06:30 | .7 | 39.9 |
| 02/22/2021 | 3.6 as of 11:30 | 3.6 | 43.5 |
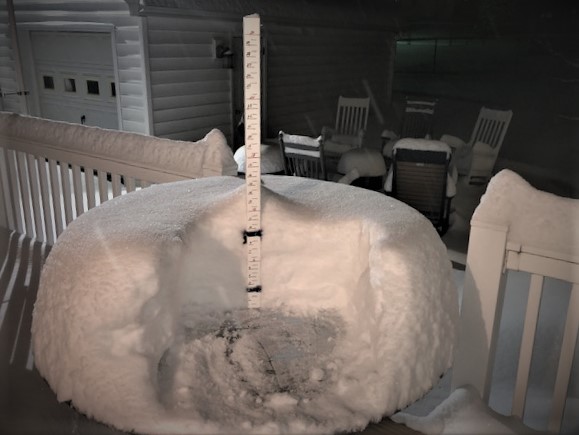
This is my Snowboard for measuring accumulated snow totals. After taking a measurement with a ruler, the snow is wiped away until the next measurement.